WP1. Developing a framework for quantifying food-water-energy interactions (RQ1/RO1).
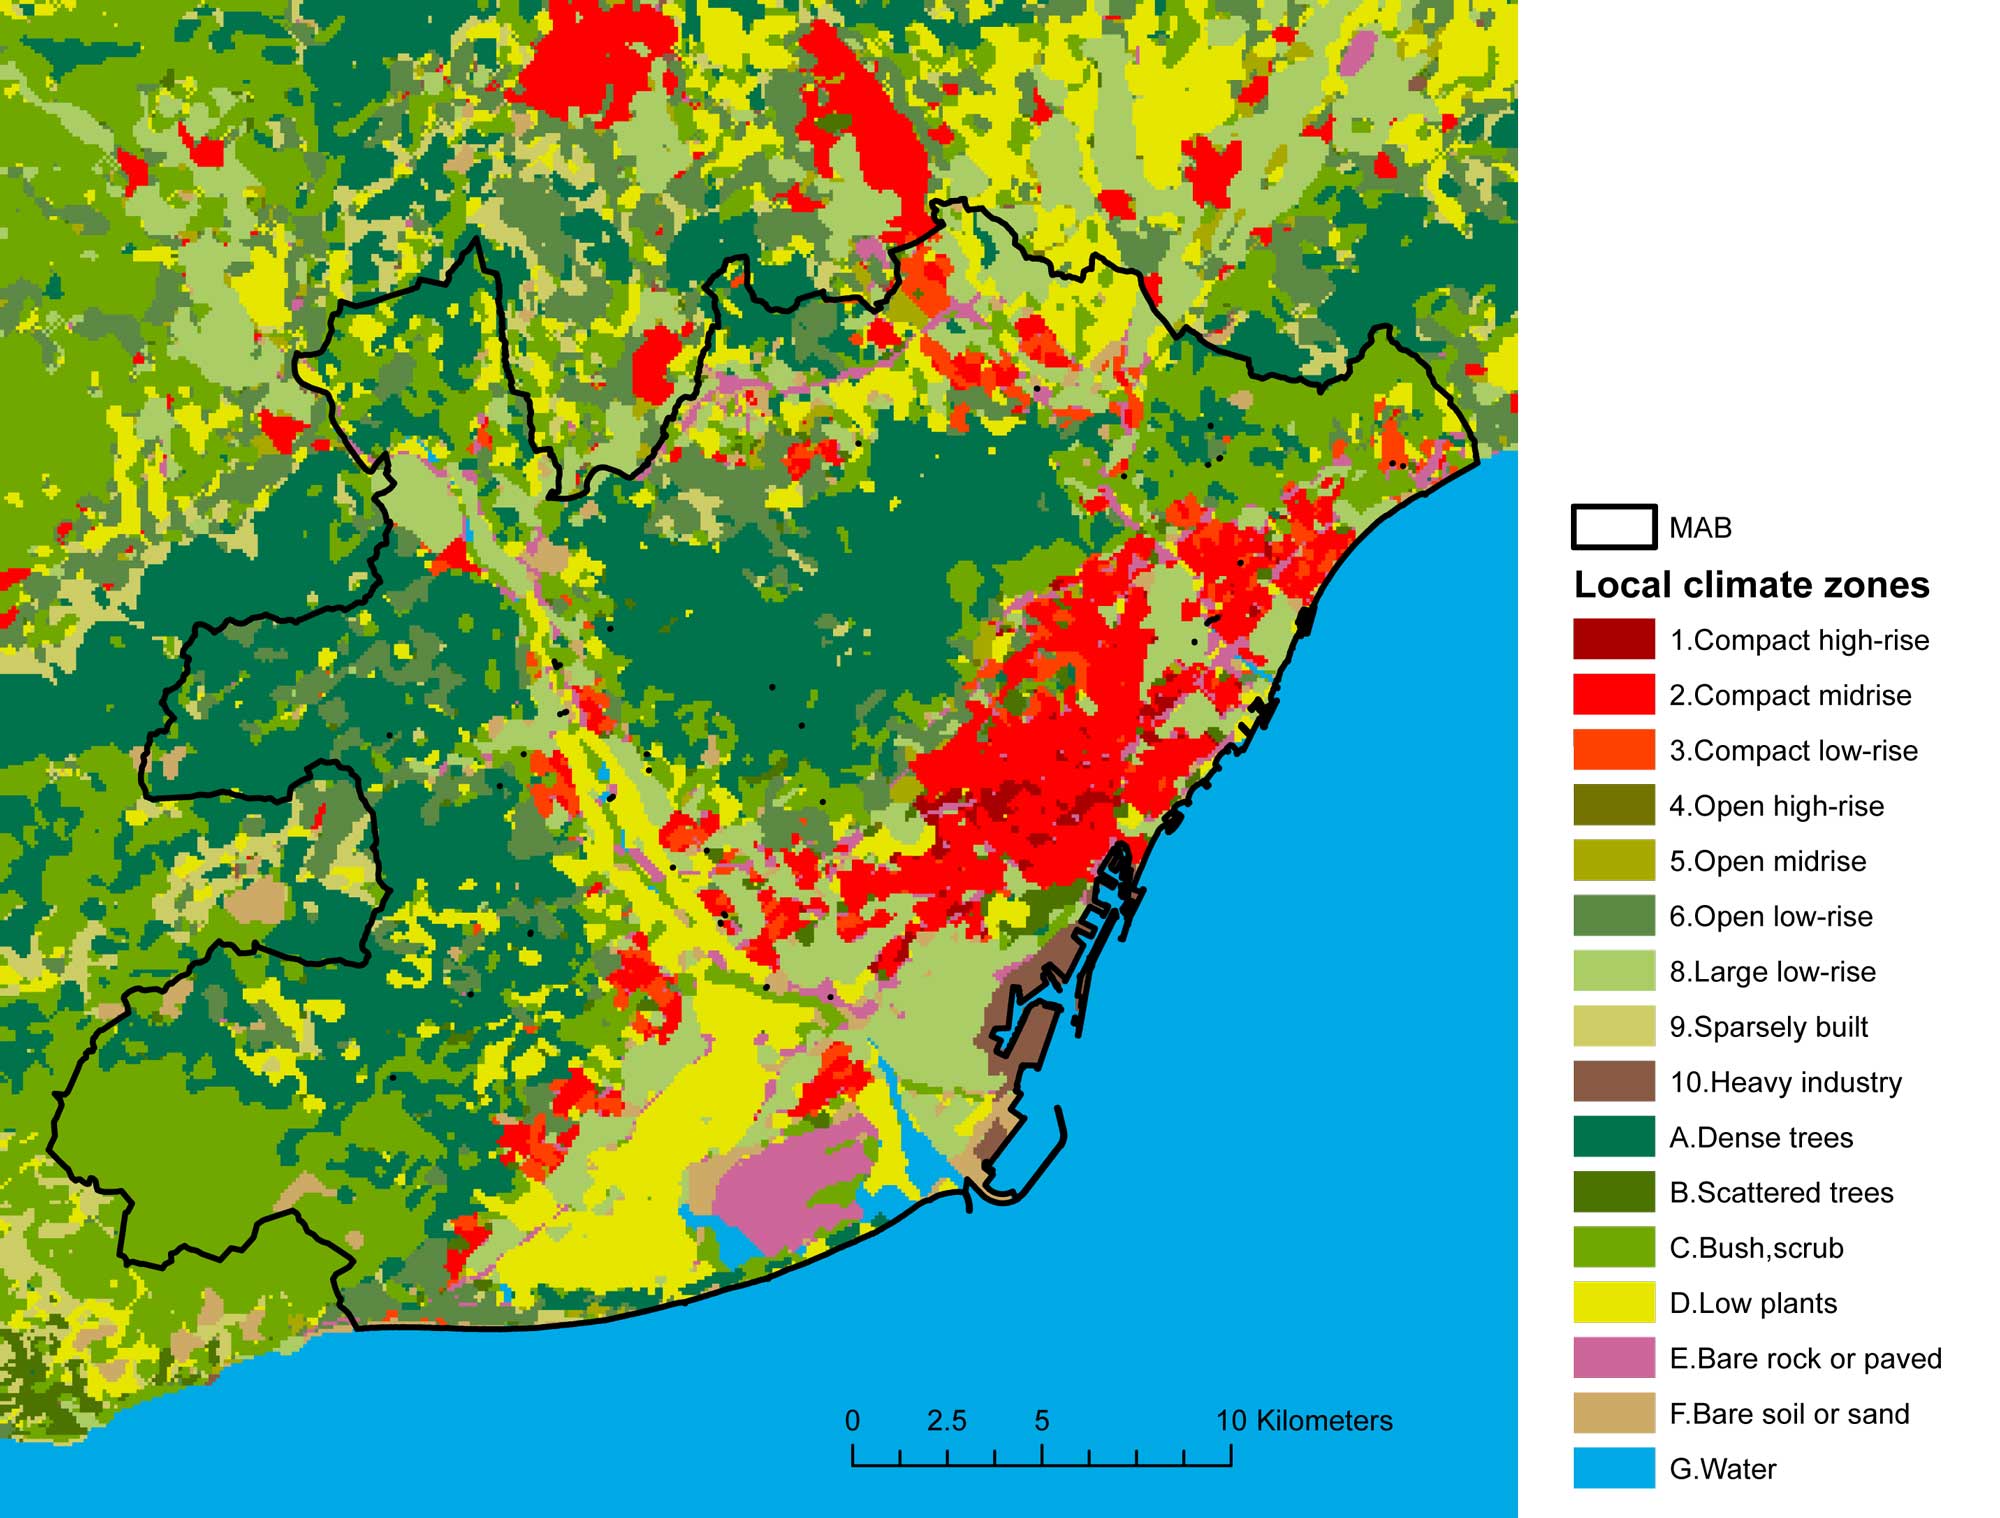
Task 1.1 Creation of a high-resolution geo-spatial model to delineate present land uses in both Oslo and Barcelona such as green and constructed areas, as well as the location of wastewater treatment and solid waste treatment plants.

Task 1.2 Perform a city-wide urban metabolism study by quantifying the flows of food, energy, and water.
Task 1.3 Dynamic material flow analysis of recovered nutrients and collected rainwater for local food optimization to determine the rates of waste and wastewater treatment and the potential nutrient recovery of the treatment plants as well as the rainwater recovery potential in a neighbourhood and buildings. By means of a dynamic geo-referenced material flow analysis model, the team will be able to determine the energy requirements of collecting rainwater and transporting the recovered nutrients to the green infrastructures in urban and peri-urban areas.
Task 1.4 Determine the urban food production potential based on food demand for each city, potential roof spaces and available peri-urban areas.
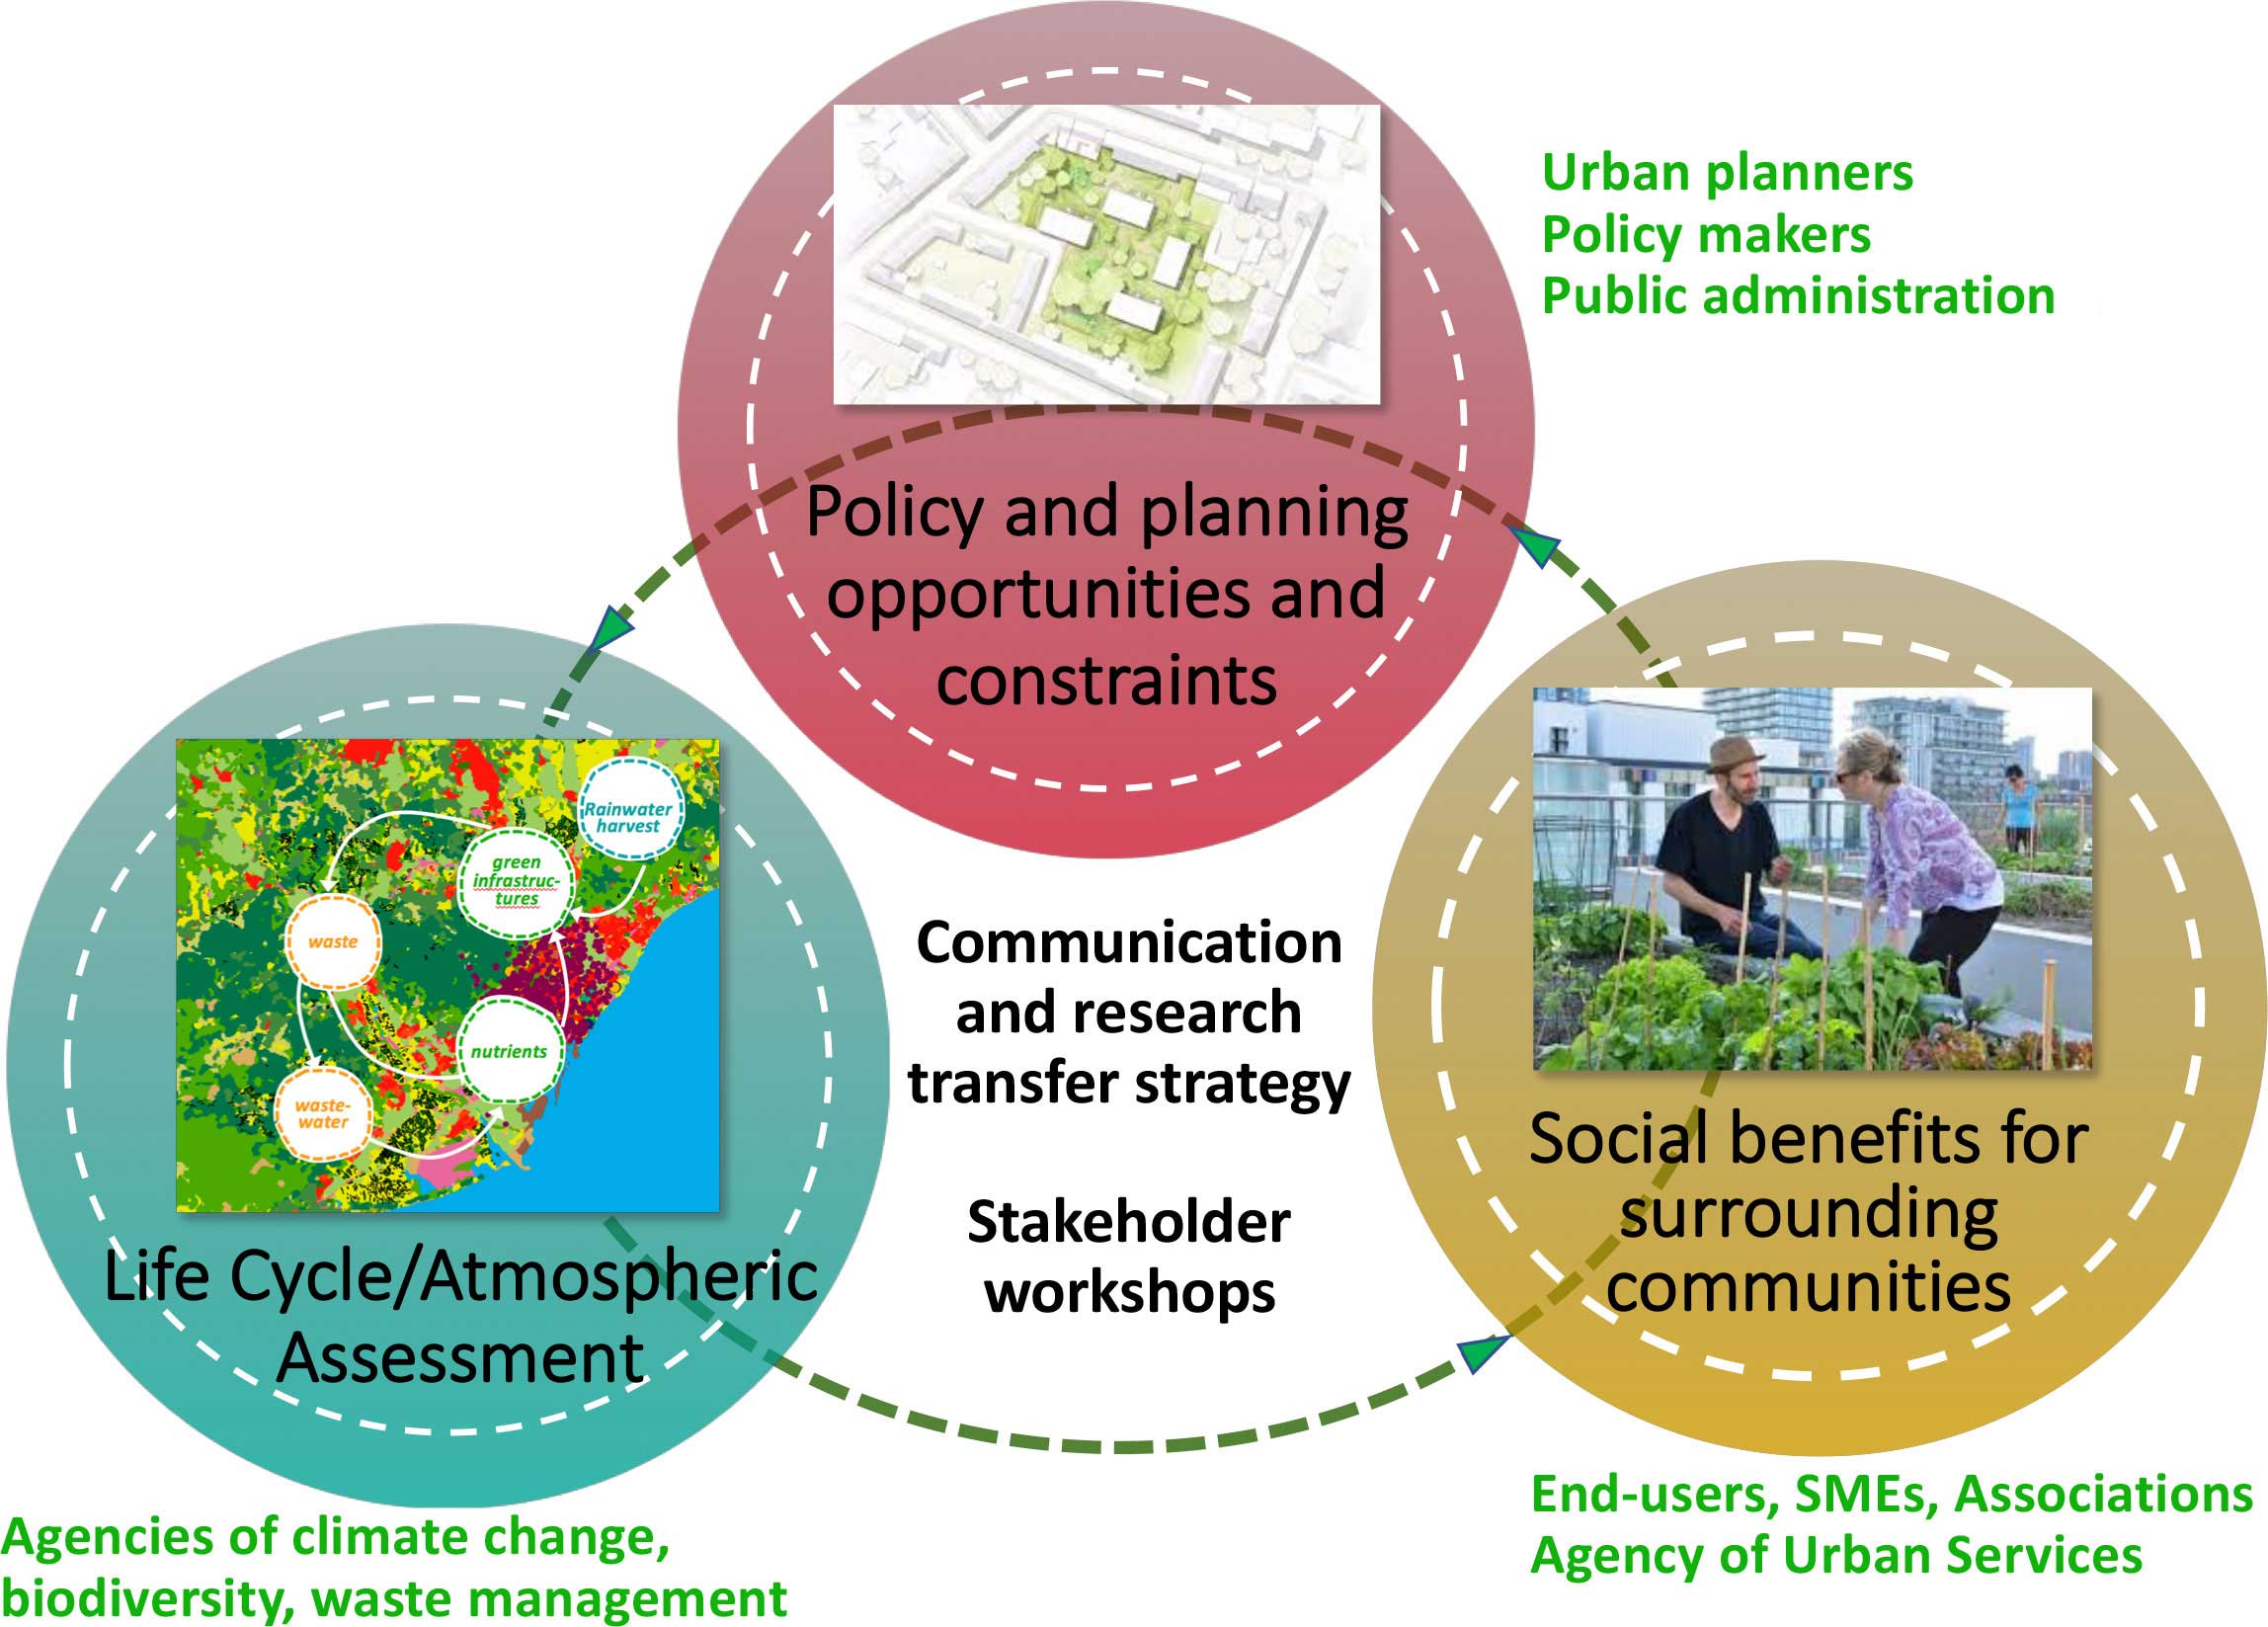
Task 1.5 Develop the scenarios. The team will design several scenarios based on feedback from the tasks described above, WP2 (how the green infrastructures affect the urban atmosphere), and the first stakeholder workshop of WP3 (what are the life cycle impacts, the city’s greening policies and social implications of the green infrastructures).
WP2. Develop a spatially-temporally resolved framework for quantitative analysis and simulation of green infrastructures (RQ2/RO2).
We will study the variations in temperature, including the urban heat island effect, and correlate them with the land use (artificial surfaces, green infrastructures, etc.) based on the data gathered and processed in task 1.1, as well meteorological data measured by weather stations located in Oslo and Barcelona. Moreover, concentrations of CO, NO2, O3, PM10 and PM2.5, VOC and SO2 from local air quality monitoring networks will also be analyzed and crossed with the urban land-use, meteorological variables and anthropogenic heat fluxes to determine human comfort indicators such as air quality and thermal comfort.
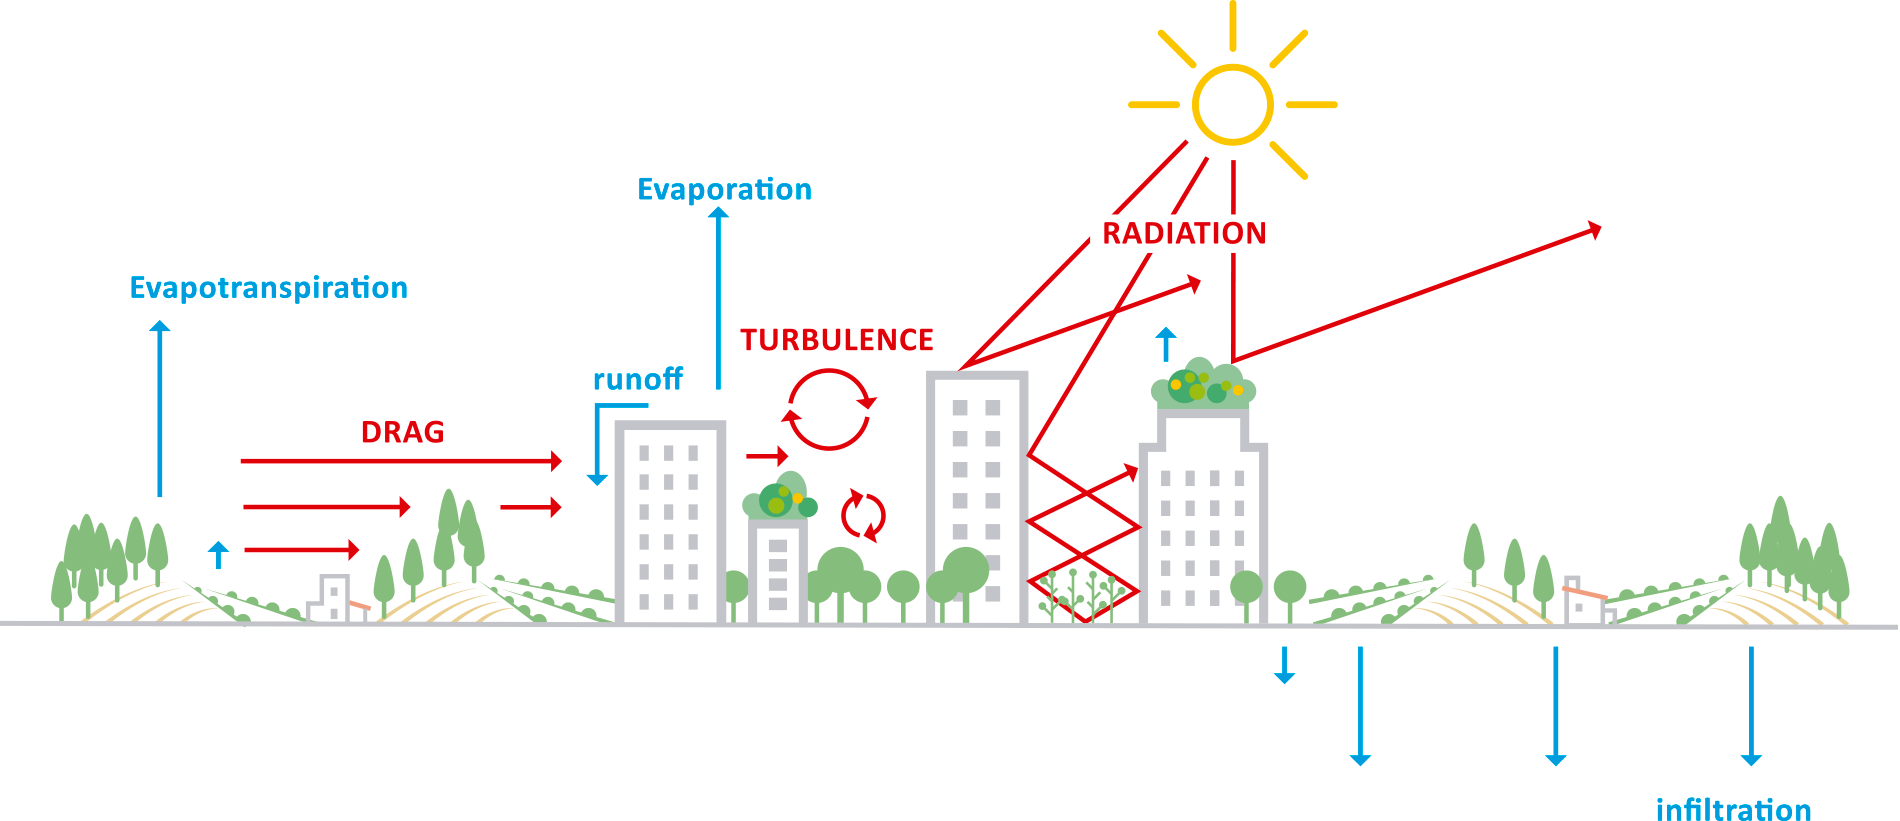
As a second part of this task, the regional and Eulerian weather chemical modeling system WRF-Chem80 will be applied over both cities with the urban canopy model 81 at high-resolution. An innovative spatial disaggregation approach will be created based on land-use and/or local climate zone information to increase the resolution of emissions up to 100m. The WRF-Chem will be run with an urban canopy scheme to capture the changes in humidity and ambient temperature patterns due to increased evapotranspiration from vegetation and modifications on the albedo of urban surface. Such high-resolution land-use allows for a more precise energy budget which considers the height of the building, the turbulence created by street canyons, irrigation of green infrastructures, and the albedo of buildings and green areas.

To constrain the photosynthetic uptake of CO2 by green infrastructures, we will use carbonyl sulfide (OCS) as a tracer. Since OCS is only produced in the oceans and consumed by plants on land, the fact that the two cities are coastal is key in the analysis to determine the OCS drawdown as air masses travel from the sea onto the land. We will take measurements of observed OCS concentrations at various key locations of the urban and peri-urban green infrastructure areas of the two. The expected outcome is to be able to quantify the CO2 uptake of green infrastructures through OCS simulations of the case study city scenarios and demonstrate how the global OCS inventories can be applied to other cities as well.
The team will attempt to answer the following questions: 1) To what extent does the performance of various green infrastructures vary throughout a meteorological year under the same climate condition? 2) What are the most appropriate green infrastructures in terms of air quality, carbon footprint and urban heat island effect? 3) To improve air quality and reduce heat stress in both case studies, where should the green infrastructures be placed: near the emission sources (main road-infrastructures, for instance) or near residential areas?
WP3 Integrated assessment of green infrastructure analysis (RQ3/RO3).
The integrated assessment of green infrastructures will be performed for the two cities by using life cycle analysis and atmospheric modeling, and will incorporate social and policy implications. The team will determine the carbon footprint resulting from the city´s metabolism of food, water, energy and waste management.
The team will pay particular attention to the policy and planning opportunities and constraints to further develop green spaces and ensure that their benefits are equitably distributed and that the needs, languages, identities, and uses of surrounding residents are considered. Two stakeholder workshops (year 1 and year 4 of project) will help strategize the policies and targets the cities have in place for green infrastructure, carbon footprint reduction, and air quality.
